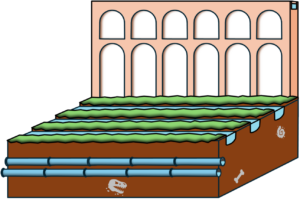
Whenever you turned on your sink or flushed your toilet, have you wondered how that water got there? Believe it or not, that was not magic. It is one of the great quiet feats of human engineering! Water distribution has existed for thousands of years, beginning as crude canals built to bring water to crops, eventually developing into aqueducts that can carry water over long distances and clay pipes that can contain pressurized water.
Where Your Water Comes From
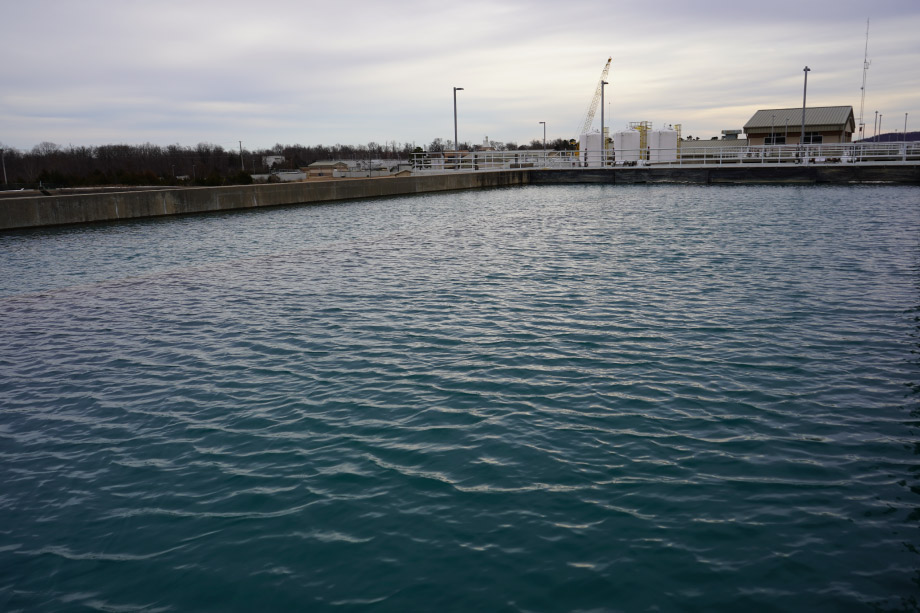
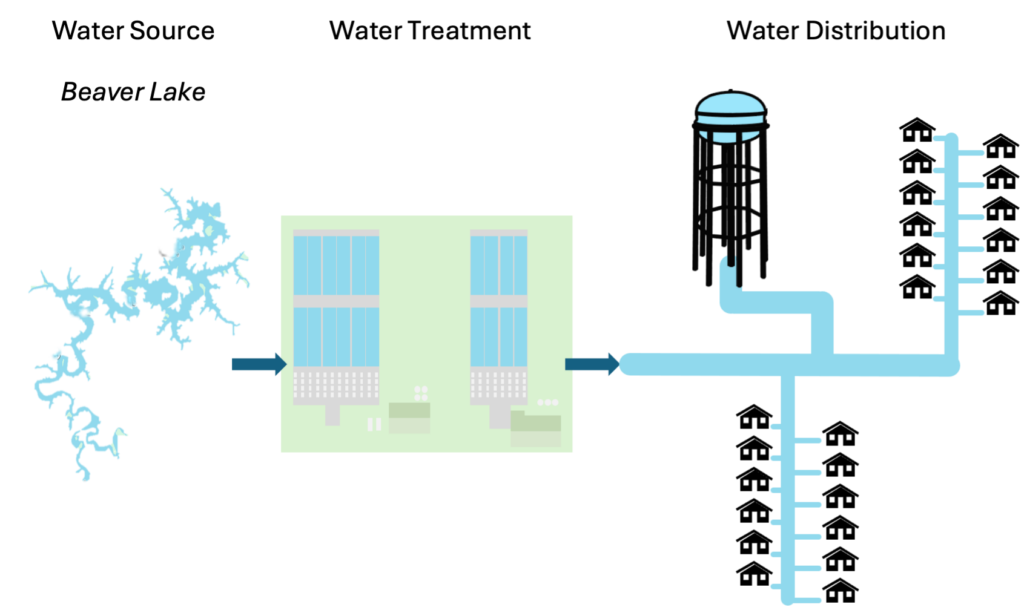
In Northwest Arkansas, the journey starts at Beaver Lake. From there, water travels to a treatment plant, where it’s cleaned to be safe to drink. After treatment, it enters the distribution system — the network of pumps, pipes, and storage tanks that carries it the rest of the way to your house.
The Invisible Distribution of Water
Every city and town has a unique water distribution system that needs to be managed and maintained. Cars have a dashboard full of gauges and warning lights to tell us how the engine is doing. Water systems have something similar — and that something is called SCADA.
SCADA: Supervisory Control And Data Acquisition. It’s a computer system that lets water operators see what’s happening across the distribution system in real time. SCADA can monitor water storage levels, water pressure, and water cleanliness. It also has controls for equipment like pumps and valves.
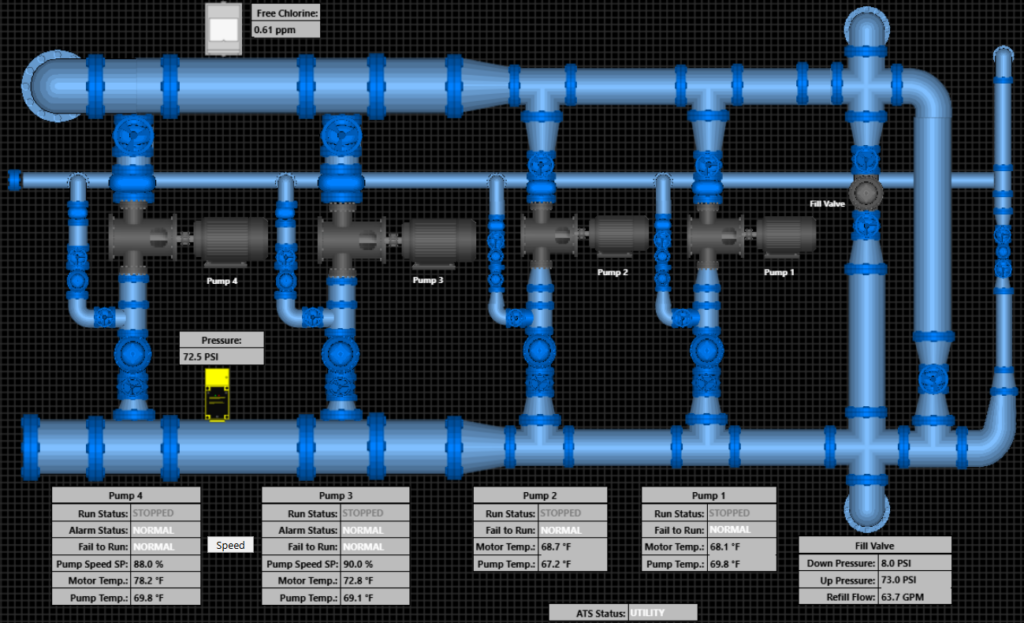
Your First Look at a SCADA Dashboard
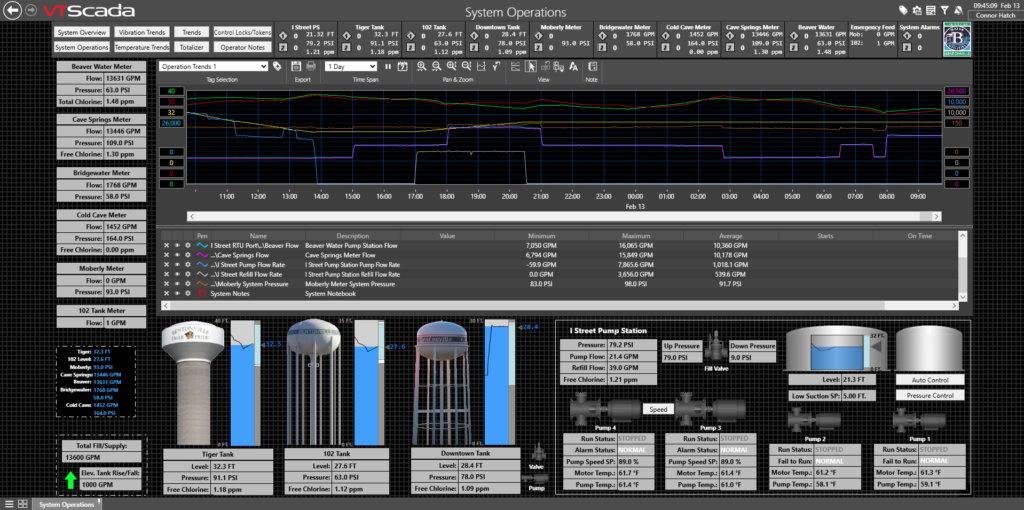
Is this what you pictured a water system would look like? At a glance you can spot a few water towers, but the rest is a wall of numbers, names, and colored lines. That’s normal — almost the entire system is buried underground, so “seeing” it is impossible unless something has gone horribly wrong.
Here’s a quick tour so the screen feels less overwhelming:
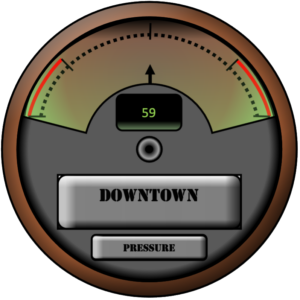
- Down the left side: live readings from meters around the city — flow, pressure, and chlorine at each location.
- Across the top: The header that navigates the pages of the full program (and some key indicators for at-a-glance reference)
- The big black graph in the middle: 24 hours of activity, with each colored line showing how one measurement changed over time.
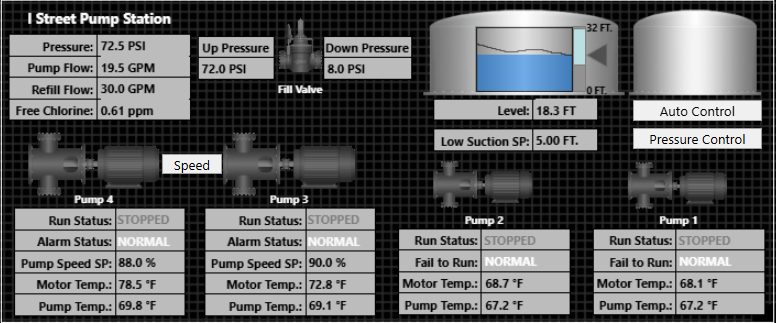
- Across the bottom: real-time pictures and controls of the water tanks and pump stations.
There’s nothing simple about water hydraulics, but to a trained operator, every number and every colored line on this screen tells a story about the health of the system.
A note on units you’ll see throughout: PSI (pounds per square inch) measures water pressure. GPM (gallons per minute) measures how much water is moving through a pipe. ppm (parts per million) measures how much chlorine is in the water — chlorine keeps the water safe to drink. FT (feet) is used for the depth of water inside a tank.
Reading the Story in the Lines
This graph of chaotic lines is a trendline, one of the most powerful tools of SCADA. This one in particular follows the events of the water distribution system in a 24 hour period. If you happened to flush a toilet on February 9th, 2026 in Bentonville, you have contributed to this SCADA historian record! Your service is appreciated.
Additional Note: SCADA uses military time, which counts the day from 00:00 (midnight) to 23:59. So 1 p.m. shows up as 13:00. The water industry uses this format because it lets different pieces of equipment around the system stay perfectly in sync.
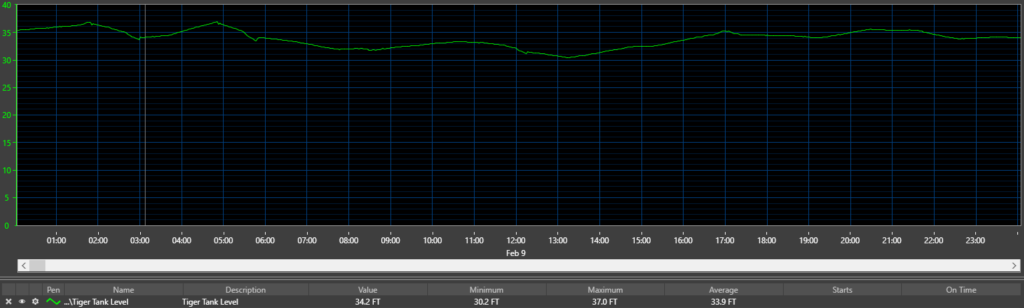
One Trend line by itself can tell a simple story. On February 9th Tiger water tank began with 35ft of stored water (out of 40ft in the bowl at the top), went up and down a bit, and ended the day around the same level.
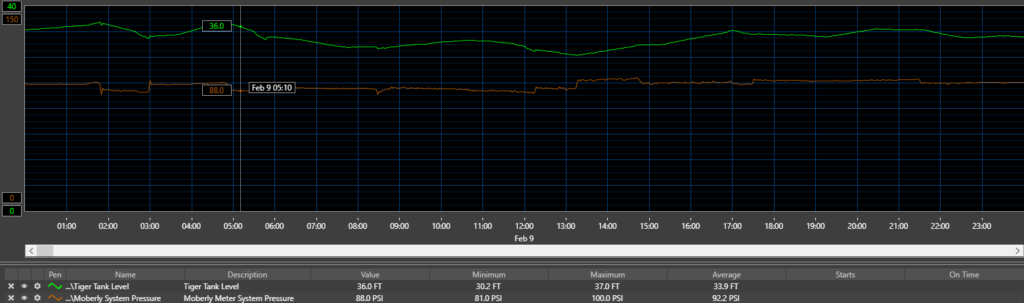
The story gets interesting when you add another line. Moberly system pressure (PSI) adds new context and new questions. The Tiger line now pivots direction whenever the pressure changes. What is changing the pressure in the system?
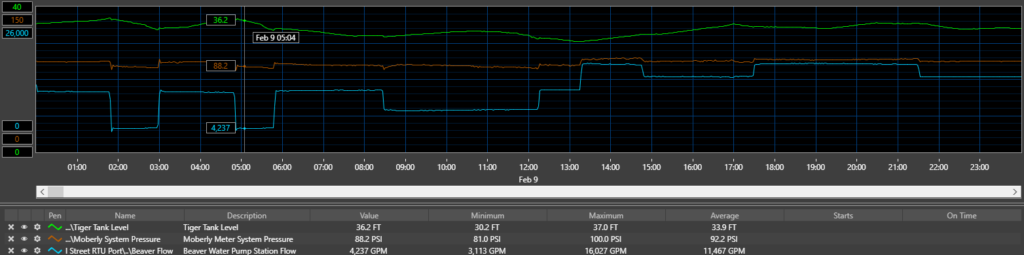
Finally, line number 3: Beaver Water District Flow (Gallons per minute). The flow from BWD is the treated safe drinking water that is being pumped into the City of Bentonville and is represented by the blue line. The changes in flow from BWD to Bentonville can allow a storage tank to rise and lower in level, as well as shift the pressure in the whole water system. Reading just these 3 lines can tell an important story and more data can enhance it. Lets look at a special one:
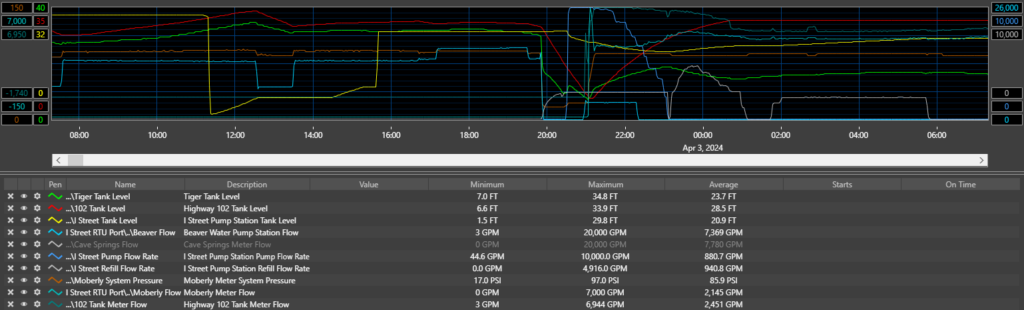
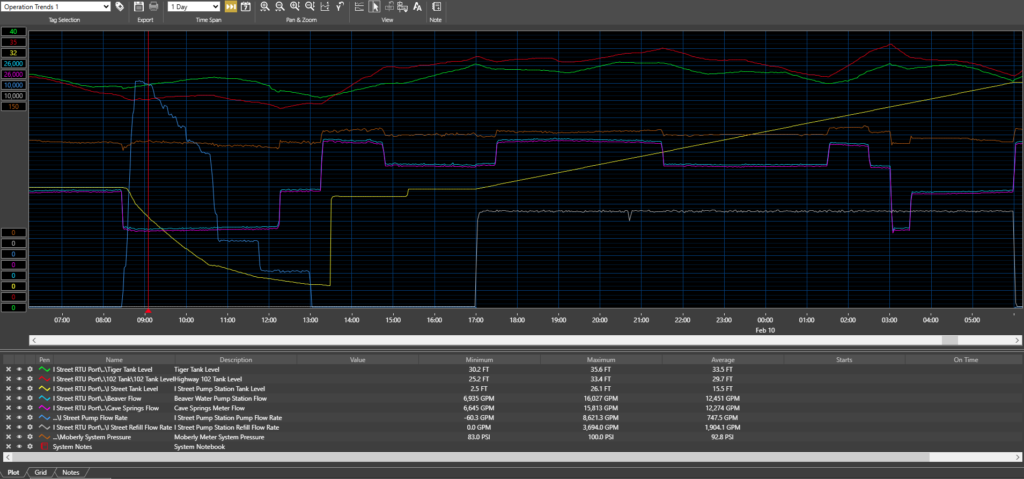
April 2nd, 2024 is an infamous day in the history of Bentonville water. This day is when a catastrophic leak happened on the main water line from BWD, and the city was forced to rely on emergency water feeds from the City of Rogers for nearly a week while the line was getting repaired.
Notice the green Tiger Tank line — it falls off a cliff just after 20:00, while the cyan BWD flow line jumps sharply at the same moment. Water was rushing out of the system somewhere it shouldn’t have been, and the data showed it almost immediately. SCADA allowed us to see the signs of danger and point crews in the right direction for action.
Powerful SCADA Tools
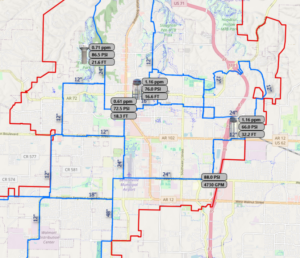 SCADA in a moment of crisis can help triangulate where a new leak in the city could be. If the water pressure near site A drops sharply, but the pressure by site B is unchanged, then we know to start looking close to site A. Studying how water moves and reacts in different times and situations will reveal the behaviors of water consumption. Trying to understand water behavior is how a vigilent SCADA operator protects the system.
Based on need, SCADA can provide different views of the same thing. SCADA isn’t just a window onto the system; it’s also a remote control. Operators can use it to start and stop pumps, open and close valves, and move water between tanks without ever leaving the office. Pumps can be controlled manually (think ON/OFF) or automatically on a variable: Pumps can be set to start when a storage tank is low, or on a timer.
SCADA and Beyond
No 2 SCADA systems look the same! Every program is tailored to the system and to the city or industry that uses it. Sometimes it’s nice to use custom graphics to have that personal touch!
SCADA is used in every corner of the water industry, and in plenty of others — oil and gas, manufacturing, electric utilities, you name it. As technology gets faster and smarter, so do the tools we use to manage the infrastructure underneath our feet.
Northwest Arkansas is growing quickly, and that growth has pushed local water utilities to keep modernizing. So the next time you turn on the tap, remember: somewhere, a colored line on a SCADA screen just twitched. Not magic — just a quiet, well-watched system doing its job.
If the water you drink comes from Beaver Lake, you’re part of that story too.